In technical analysis, chart patterns play a crucial role in predicting potential price movements of financial assets. One such pattern that investors and traders closely monitor is the head and shoulders pattern. When this pattern forms on a chart, it often signifies a trend reversal from bullish to bearish or vice versa.
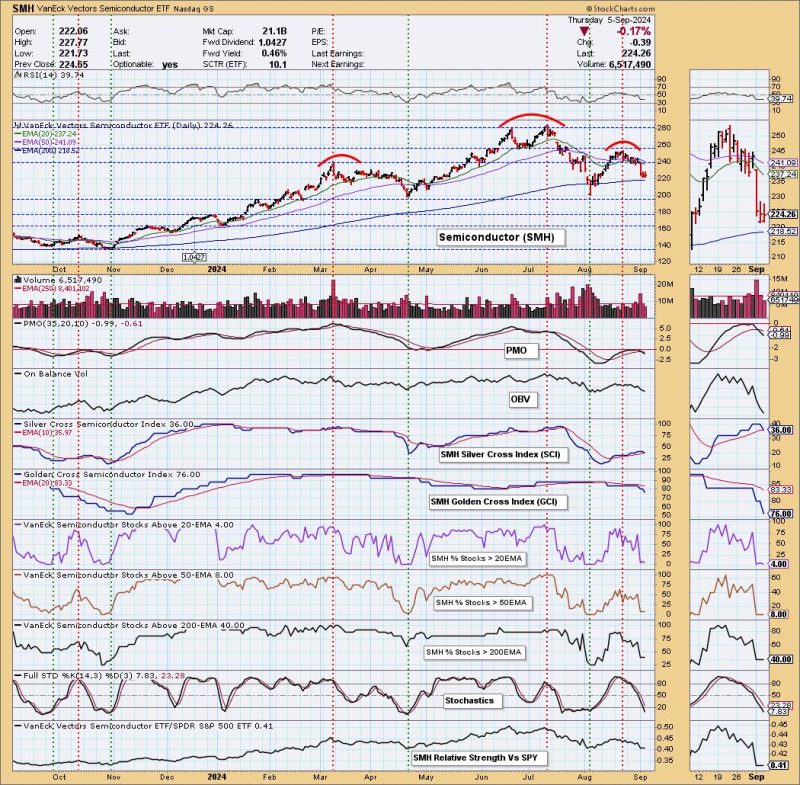
Recently, a notable head and shoulders pattern has emerged in the semiconductor sector, specifically on the VanEck Vectors Semiconductor ETF (SMH). The SMH ETF, which tracks the performance of major semiconductor companies, is a key barometer for the broader technology sector and often reflects investor sentiment towards innovation and demand for electronic components.
The head and shoulders pattern on the SMH chart suggests a potential intermediate-term bearish outlook for semiconductor stocks. This pattern consists of three peaks, with the middle peak (the head) being higher than the other two peaks (the shoulders). The neckline, drawn connecting the lows between the peaks, serves as a critical support level that, when breached, confirms the pattern and signals a shift in market sentiment.
In the case of the SMH ETF, the head and shoulders pattern has formed with the left shoulder peak in February 2021, the head peak in April 2021, and the right shoulder peak in June 2021. The neckline, which currently lies around the $240 level, is a key area to watch for a potential breakdown. If the price of the SMH ETF closes below this level, it could trigger further selling pressure and lead to a sustained downtrend in semiconductor stocks.
Additionally, technical indicators such as the moving averages, relative strength index (RSI), and MACD (Moving Average Convergence Divergence) are showing signs of potential weakness in the SMH ETF. The 50-day moving average is trending below the 200-day moving average, indicating a possible bearish crossover, while the RSI and MACD are both showing divergence from the price trend, suggesting a loss of bullish momentum.
Investors and traders closely following the semiconductor sector should pay close attention to the evolving price action of the SMH ETF and monitor the neckline level for a potential breakdown confirmation. A decisive move below the neckline could pave the way for a deeper correction in semiconductor stocks, posing challenges for the broader technology sector and market indices that are heavily weighted towards these high-growth companies.
In conclusion, the emergence of a head and shoulders pattern on the SMH chart points towards a potential intermediate-term bearish outlook for semiconductor stocks. While technical analysis provides valuable insights, it is essential to combine it with fundamental analysis and market dynamics to make informed investment decisions. As always, risk management and proper portfolio diversification are essential in navigating the ever-changing financial markets.


