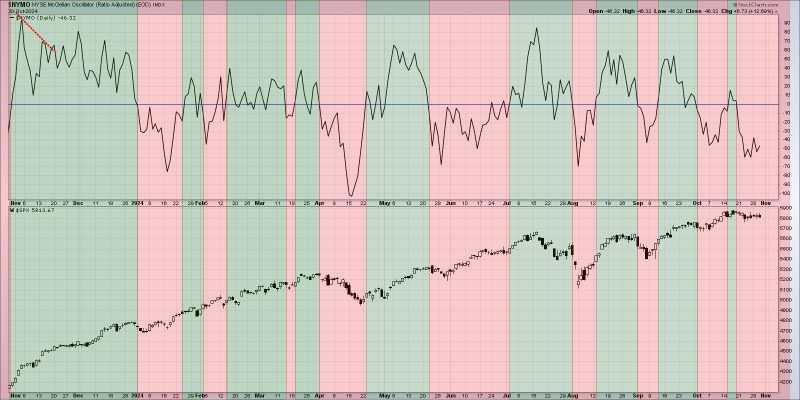
Breadth Divergences: An In-Depth Analysis of their Potential Significance
In the realm of stock market analysis, breadth divergences have long been considered as a fundamental indicator of potential shifts in market sentiment and future price trends. These divergences, which occur when the number of advancing stocks does not align with the broader market trend, have historically been regarded as a warning sign of impending market tops or bottoms.
When it comes to interpreting breadth divergences, different analysts and traders may apply varying methodologies and timeframes. Some prefer to examine short-term divergences, which can provide insights into immediate market sentiment shifts, while others focus on longer-term divergences to gauge broader market trends.
One common approach to analyzing breadth divergences is to compare the number of stocks making new highs or lows with the overall market index, such as the S&P 500. If the index is reaching new highs, but fewer individual stocks are participating in the rally, this can be interpreted as a negative breadth divergence, suggesting that the market’s strength may not be as robust as it appears.
Conversely, a positive breadth divergence occurs when a market index is declining, but an increasing number of individual stocks are showing signs of strength by reaching new highs. This can be seen as a potential bullish signal, indicating that despite the overall market weakness, certain sectors or stocks are still performing well.
In recent market conditions, breadth divergences have become increasingly noticeable, leading some investors to question whether these signals could be indicative of an impending market correction or even a broader shift in the ongoing bull market. As markets continue to navigate the uncertainties surrounding economic recovery, inflationary pressures, and geopolitical events, monitoring breadth divergences may provide valuable insights into evolving market dynamics.
It’s important to note that while breadth divergences can offer valuable insights into market sentiment, they are not foolproof indicators and should be viewed in conjunction with other technical and fundamental analysis tools. Market conditions can change rapidly, and a single divergence signal may not always accurately predict future market movements.
In conclusion, breadth divergences remain a valuable tool for investors and traders seeking to navigate the complexities of the stock market. By carefully analyzing these signals and considering them within the broader context of market trends, investors can gain a deeper understanding of market dynamics and potentially position themselves to capitalize on emerging opportunities. As with any form of market analysis, a comprehensive and multifaceted approach is key to making informed investment decisions in an ever-changing financial landscape.


