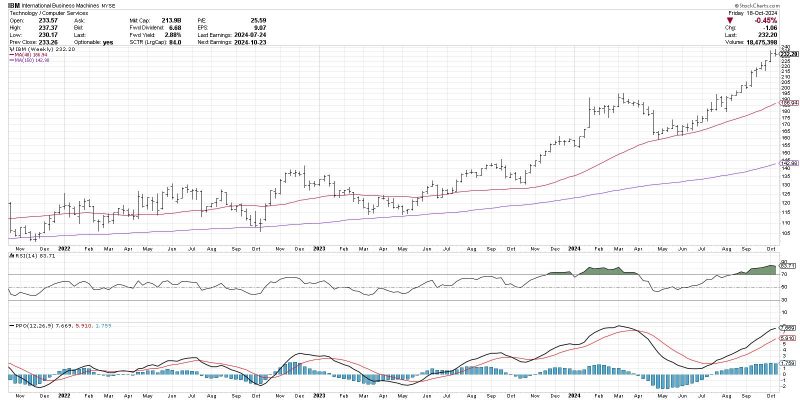
The Moving Average Convergence Divergence Histogram (MACD Histogram) is a technical indicator that is widely used by traders to help anticipate trend changes in the financial markets. Understanding how the MACD Histogram works and interpreting its signals can provide valuable insights for making informed trading decisions.
The MACD Histogram is derived from the MACD indicator, which consists of two lines – the MACD line and the Signal line. The MACD Histogram represents the difference between these two lines and is plotted as a histogram. The bars of the histogram fluctuate above and below the zero line, indicating the strength and direction of the trend.
One of the key aspects of the MACD Histogram is its ability to signal potential trend changes. When the histogram bars move above the zero line, it suggests that the price is gaining bullish momentum and a potential uptrend may be emerging. Conversely, when the bars move below the zero line, it indicates that bearish momentum is increasing, signaling a potential downtrend.
Traders often look for specific patterns or crossovers in the MACD Histogram to confirm trend changes. For example, a bullish crossover occurs when the MACD Histogram bars move above the zero line, while a bearish crossover happens when the bars move below the zero line. These crossovers can provide early indications of potential trend reversals.
Moreover, the slope of the MACD Histogram bars can also provide valuable information about the strength of the trend. Steeply rising bars indicate strong bullish momentum, while sharply declining bars suggest strong bearish momentum. Traders can use the slope of the histogram bars to gauge the intensity of a trend and adjust their trading strategies accordingly.
Additionally, divergence between the price action and the MACD Histogram can be a powerful signal of an impending trend reversal. Bullish divergence occurs when the price forms lower lows while the MACD Histogram forms higher lows, indicating that a potential uptrend may be on the horizon. On the other hand, bearish divergence happens when the price forms higher highs while the MACD Histogram forms lower highs, signaling a potential downtrend.
In conclusion, the MACD Histogram is a versatile technical indicator that can help traders anticipate trend changes in the financial markets. By analyzing the histogram bars, crossovers, slope, and divergence patterns, traders can gain valuable insights into the direction and strength of the trend, allowing them to make more informed trading decisions. Incorporating the MACD Histogram into a comprehensive trading strategy can enhance risk management and improve overall trading performance.


