In the fast-paced world of stock trading and technical analysis, the identification of chart patterns plays a pivotal role in predicting future price movements. One such chart pattern gaining attention in the recent days is the double top pattern observed in semiconductor stocks, particularly the SMH ETF.
### Overview of Double Top Pattern
A double top pattern is a technical analysis pattern that signals a potential reversal of an uptrend. It occurs when the price reaches a high level twice with a moderate decline in between. The pattern is completed when the price breaks below the support level formed by the lows between the two peaks.
### Double Top Formation in Semiconductor Stocks
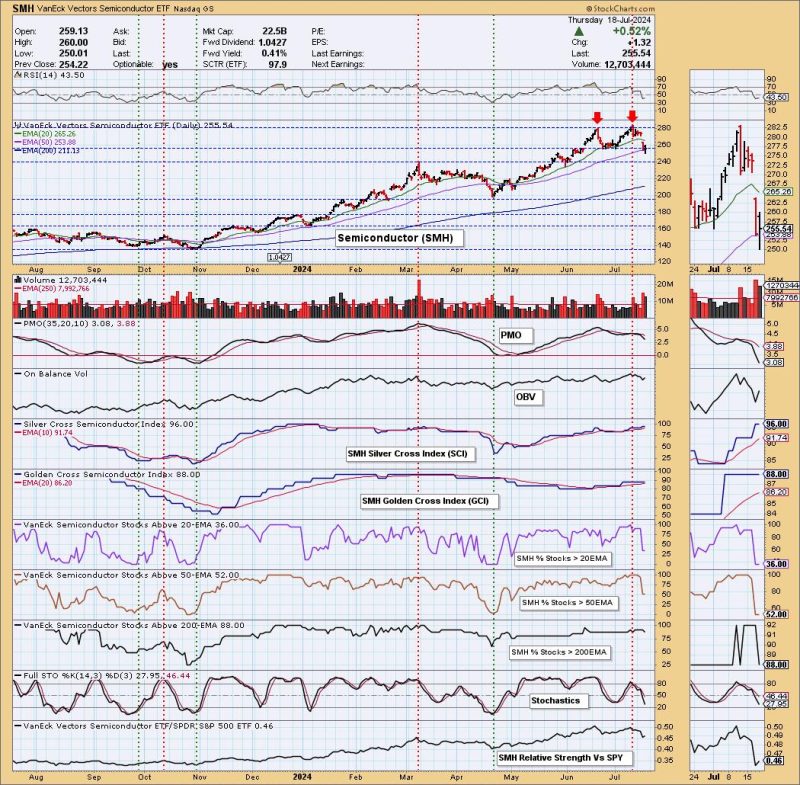
The SMH ETF, which tracks the performance of semiconductor companies, has displayed a clear double top pattern in recent trading sessions. The first peak occurred at a significant resistance level, followed by a decline to form a valley, only to rally back to near the previous high. This second peak formed the double top pattern, signaling a potential reversal in the upward trend of semiconductor stocks.
### Implications of the Double Top Pattern
For traders and investors closely following the semiconductor sector, the double top pattern on the SMH ETF could be a crucial indicator of a potential trend reversal. The pattern suggests that the bulls are losing steam, and the bears might take control, leading to a possible downtrend.
### Trade Strategies in Light of the Double Top Pattern
Traders and investors analyzing the double top pattern on semiconductor stocks like SMH may consider adopting certain trade strategies. It is crucial to wait for a confirmed break below the support level to validate the pattern. This could be an opportune moment to consider short positions or exit long positions in semiconductor stocks, as the likelihood of a downward move increases.
### Conclusion
In conclusion, the double top pattern observed in semiconductor stocks, specifically the SMH ETF, has provided traders and investors with a valuable technical signal. By recognizing and understanding the implications of this pattern, market participants can make informed decisions regarding their positions in semiconductor stocks. As always, it is advisable to combine technical analysis with other tools and indicators for a comprehensive assessment of market conditions.


